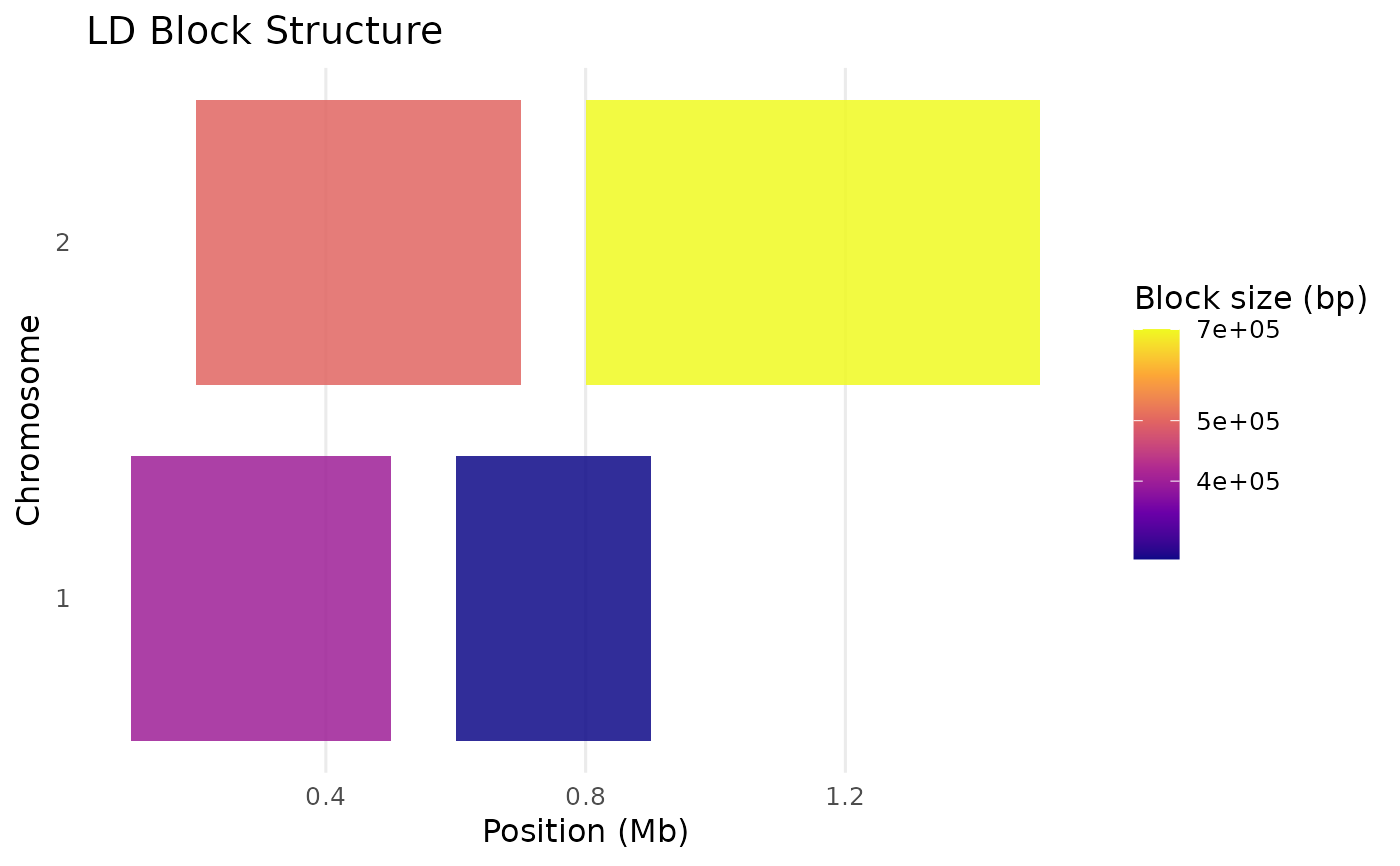
Produces a ggplot2-based overview of LD block boundaries and sizes.
Requires ggplot2 to be installed.
Usage
plot_ld_blocks(
  blocks,
  colour_by = c("length_bp", "CHR"),
  highlight_blocks = NULL,
  mb_scale = TRUE
)
Arguments
- blocks
Data frame of LD blocks (output of
run_Big_LD_all_chr). Must containstart.bp,end.bp, andCHR.- colour_by
Character. One of
"length_bp"(default, colours by block size) or"CHR"(distinct colour per chromosome).- highlight_blocks
Optional integer vector of row indices in
blocksto highlight with a solid border outline.NULL(default) highlights nothing.- mb_scale
Logical. If
TRUE(default), x-axis is in Megabases.
Examples
# \donttest{
if (requireNamespace("ggplot2", quietly = TRUE)) {
  blocks <- data.frame(
    CHR      = c("1", "1", "2", "2"),
    start.bp = c(1e5, 6e5, 2e5, 8e5),
    end.bp   = c(5e5, 9e5, 7e5, 1.5e6)
  )
  p <- plot_ld_blocks(blocks)
  print(p)
}

# }
# }